
Executive Summary #
- For
WHERE user_id = ? AND created_at >= ? ORDER BY created_at DESC LIMIT 50, a composite index on(user_id, created_at DESC)turns the plan from (Parallel) Seq Scan + Sort into a simple Index Scan + Limit. - In my runs, the no-index plan grew roughly with table size (8ms → 40–46ms → 161–173ms), while the indexed plan stayed sub-millisecond (≈0.04–0.15ms).
- Don’t over-trust single-run milliseconds. Use plan shape + BUFFERS as primary evidence; timing variance can come from scheduling and parallel workers.
Environment (validated on) #
- PostgreSQL: 16 (Docker)
- Host: macOS (MacBook Pro, 8-core Intel i9, 64GB RAM)
- Table:
orders(synthetic data) - Dataset sizes: 100k / 1M / 5M rows
- Command used:
EXPLAIN (ANALYZE, BUFFERS) ...
Note: results vary by hardware and caching. The key takeaway is the plan change and the buffer usage, not the absolute timings.
Query pattern #
This is a very common OLTP pattern:
- filter by tenant/user (
user_id) - apply a time range (
created_at >= now() - interval '30 days') - return the most recent N rows (
ORDER BY created_at DESC LIMIT 50)
EXPLAIN (ANALYZE, BUFFERS)
SELECT id, user_id, created_at
FROM orders
WHERE user_id = :uid
  AND created_at >= now() - interval '30 days'
ORDER BY created_at DESC
LIMIT 50;
Why indexes matter here (high-level) #
Without a supporting index, PostgreSQL must:
- scan the table (or a large portion)
- filter rows
- sort matching rows by
created_at DESC - return only the first 50 rows
With a composite index (user_id, created_at DESC), PostgreSQL can:
- locate the matching key range in the index
- already read rows in the correct order
- stop early due to
LIMIT(top-N)
Schema and index #
Table (simplified) #
CREATE TABLE orders (
  id BIGSERIAL PRIMARY KEY,
  user_id BIGINT NOT NULL,
  status TEXT NOT NULL,
  total_cents INT NOT NULL,
  created_at TIMESTAMPTZ NOT NULL DEFAULT now()
);
Fix: composite index aligned with filter + sort #
CREATE INDEX idx_orders_user_created_at_desc
ON orders (user_id, created_at DESC);
Results summary (Execution Time) #
I ran each query twice (run #1 and run #2) to observe run-to-run variance (caching/scheduling).
Values below are from
Execution Time:inEXPLAIN (ANALYZE, BUFFERS)(not theTime:line from psql).
| Dataset | Index | Run #1 (ms) | Run #2 (ms) | Notes |
|---|---|---|---|---|
| 100k | No | 8.020 | 7.976 | Seq Scan + Sort |
| 100k | Yes | 0.066 | 0.043 | Index Scan; run #1 had a few buffer reads |
| 1M | No | 40.803 | 46.356 | Parallel Seq Scan + Sort + Gather Merge |
| 1M | Yes | 0.071 | 0.059 | Index Scan; run #1 had read=3, run #2 all hits |
| 5M | No | 173.209 | 161.405 | Parallel Seq Scan; heavy buffer reads |
| 5M | Yes | 0.154 | 0.068 | Index Scan; run #1 had read=18, run #2 all hits |
Execution time comparison:
Execution time trend:
Conclusion: The composite index delivers a 1,500x speedup at 5M rows, maintaining near-constant performance as data scales.
Speedup (approx.) #
Using the first run only for a conservative comparison:
| Dataset | No index (ms) | With index (ms) | Speedup |
|---|---|---|---|
| 100k | 8.020 | 0.066 | ~121× |
| 1M | 40.803 | 0.071 | ~575× |
| 5M | 173.209 | 0.154 | ~1125× |
Plan anatomy: no index vs with index #
100k rows (no index): Seq Scan + Sort #
Key lines:
Seq Scan on ordersSort Key: created_at DESC
Sort
  -> Seq Scan on orders
       Filter: (user_id = 12508 AND created_at >= now() - '30 days')
Execution Time: 8.020 ms (run #1)
Execution Time: 7.976 ms (run #2)
Buffers: shared hit=820
What happens:
- PostgreSQL scans the table, filters almost all rows (
Rows Removed by Filter: 99995) - then sorts the matching set by
created_at DESCto return the newest rows
100k rows (with index): Index Scan + Limit #
Key lines:
Index Scan using idx_orders_user_created_at_descIndex Cond: (user_id = ... AND created_at >= ...)
Index Scan using idx_orders_user_created_at_desc on orders
  Index Cond: (user_id = 12508 AND created_at >= now() - '30 days')
Execution Time: 0.066 ms (run #1)  Buffers: hit=8 read=3
Execution Time: 0.043 ms (run #2)  Buffers: hit=8
Interpretation:
- run #1 had small
read=3(cold-ish pages loaded) - run #2 is fully cached (
hitonly), so even faster
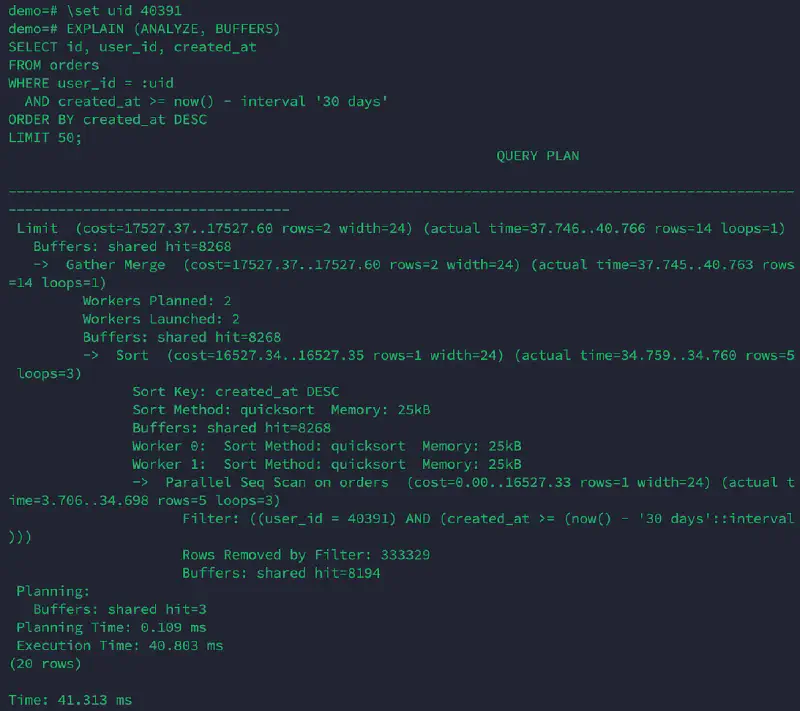
1M rows (no index): Parallel Seq Scan + Sort + Gather Merge #
This is a good reminder: PostgreSQL can use parallelism to reduce the pain of a full scan, but it does not change the fundamental cost.
Key lines:
Parallel Seq Scan on ordersSortGather Merge
Gather Merge
  -> Sort
       -> Parallel Seq Scan on orders
            Filter: (user_id = 40391 AND created_at >= now() - '30 days')
Execution Time: 40.803 ms (run #1)
Execution Time: 46.356 ms (run #2)
Buffers: shared hit=8268
Why was run #2 slower (40.8ms → 46.3ms)? #
- The plan is identical, and
Buffersare identical (shared hit=8268, no reads). - The difference comes from CPU scheduling and parallel worker timing.
- This is normal variance in containerized environments and for parallel plans.
Takeaway: Use plan + buffers as primary evidence. A single run’s milliseconds can fluctuate.
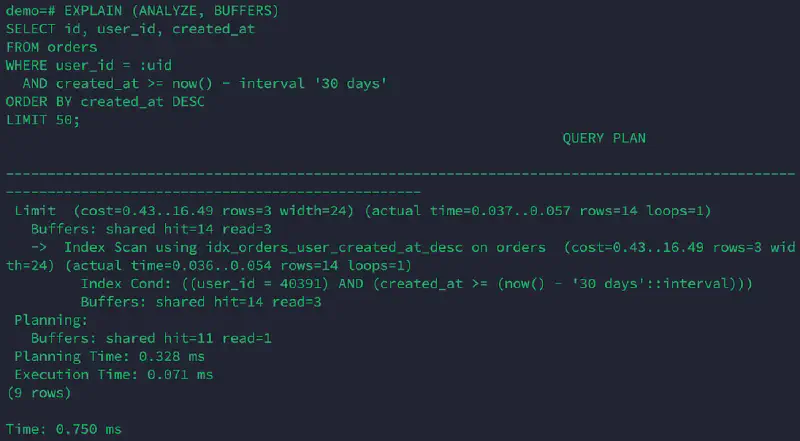
1M rows (with index): Index Scan + Limit (stable and fast) #
Index Scan using idx_orders_user_created_at_desc on orders
  Index Cond: (user_id = 40391 AND created_at >= now() - '30 days')
Execution Time: 0.071 ms (run #1) Buffers: hit=14 read=3
Execution Time: 0.059 ms (run #2) Buffers: hit=17
5M rows (no index): Parallel Seq Scan + Sort + heavy buffer reads #
Here the no-index cost becomes very obvious:
Gather Merge
  -> Sort
       -> Parallel Seq Scan on orders
            Filter: (user_id = 40391 AND created_at >= now() - '30 days')
Execution Time: 173.209 ms (run #1)
Execution Time: 161.405 ms (run #2)
Buffers: shared hit≈12k read≈28k
Interpretation:
- Large read volume (
read≈28k) indicates significant data had to be pulled into memory. - Even with parallelism, scanning and sorting at this scale is expensive.
5M rows (with index): Index Scan + Limit #
Index Scan using idx_orders_user_created_at_desc on orders
  Index Cond: (user_id = 40391 AND created_at >= now() - '30 days')
Execution Time: 0.154 ms (run #1) Buffers: hit=10 read=18
Execution Time: 0.068 ms (run #2) Buffers: hit=28
Interpretation:
- run #1 loads some pages (
read=18) - run #2 becomes fully cached and extremely fast
Key takeaways (rules of thumb) #
-
Design indexes to match the access pattern
Forfilter + ORDER BY + LIMIT, align the composite index with both the filter predicate and the sort order. -
Parallel Seq Scan is not an index strategy
Parallelism can reduce wall-clock time, but it still scans and filters a large dataset. -
Always read EXPLAIN with BUFFERS
shared hitsuggests memory hitsreadindicates disk reads / cache misses For performance investigations, plan + buffers are more reliable than a single timing value.
-
Use multiple runs or median for reporting
Run-to-run variance is normal due to scheduling and background work. For write-ups, run 3–5 times and report median if you need stronger rigor.
Reproduce this lab (minimal steps) #
- Create the table and load synthetic data (100k / 1M / 5M)
ANALYZE orders- Run the query twice without the composite index
- Create the composite index
(user_id, created_at DESC) ANALYZE orders- Run the same query twice again
- Record: plan shape,
Execution Time,Buffers
Appendix: exact EXPLAIN outputs (selected) #
100k — no index (run #1) #
Limit ... (actual time=8.002..8.004 rows=5 loops=1)
  -> Sort (Sort Key: created_at DESC)
       -> Seq Scan on orders
            Filter: ((user_id = 12508) AND (created_at >= (now() - '30 days'::interval)))
            Rows Removed by Filter: 99995
Execution Time: 8.020 ms
Buffers: shared hit=820
100k — with index (run #1) #
Limit ... (actual time=0.046..0.053 rows=5 loops=1)
  -> Index Scan using idx_orders_user_created_at_desc on orders
       Index Cond: ((user_id = 12508) AND (created_at >= (now() - '30 days'::interval)))
Execution Time: 0.066 ms
Buffers: shared hit=8 read=3
1M — no index (run #1) #
Limit ... (actual time=37.746..40.766 rows=14 loops=1)
  -> Gather Merge (Workers Planned: 2, Workers Launched: 2)
       -> Sort (Sort Key: created_at DESC)
            -> Parallel Seq Scan on orders
                 Filter: ((user_id = 40391) AND (created_at >= (now() - '30 days'::interval)))
                 Rows Removed by Filter: 333329
Execution Time: 40.803 ms
Buffers: shared hit=8268
1M — with index (run #1) #
Limit ... (actual time=0.037..0.057 rows=14 loops=1)
  -> Index Scan using idx_orders_user_created_at_desc on orders
       Index Cond: ((user_id = 40391) AND (created_at >= (now() - '30 days'::interval)))
Execution Time: 0.071 ms
Buffers: shared hit=14 read=3
5M — no index (run #1) #
Limit ... (actual time=169.092..173.186 rows=25 loops=1)
  -> Gather Merge (Workers Planned: 2, Workers Launched: 2)
       -> Sort (Sort Key: created_at DESC)
            -> Parallel Seq Scan on orders
                 Filter: ((user_id = 40391) AND (created_at >= (now() - '30 days'::interval)))
                 Rows Removed by Filter: 1666658
Execution Time: 173.209 ms
Buffers: shared hit=12352 read=28688
5M — with index (run #1) #
Limit ... (actual time=0.042..0.132 rows=25 loops=1)
  -> Index Scan using idx_orders_user_created_at_desc on orders
       Index Cond: ((user_id = 40391) AND (created_at >= (now() - '30 days'::interval)))
Execution Time: 0.154 ms
Buffers: shared hit=10 read=18
5M — with index (run #2) #
Limit  (cost=0.44..72.78 rows=17 width=24) (actual time=0.020..0.053 rows=25 loops=1)
  ->  Index Scan using idx_orders_user_created_at_desc on orders  (cost=0.44..72.78 rows=17 width=24) (actual time=0.019..0.050 rows=25 loops=1)
        Index Cond: ((user_id = 40391) AND (created_at >= (now() - '30 days'::interval)))
Execution Time: 0.068 ms
Buffers: shared hit=28
Screenshots are provided as proof of real execution; the reproducible SQL and text outputs above are the primary source.
Screenshot: 1M rows (no index, run #1) #
Screenshot: 1M rows (with composite index, run #1) #
FAQ #
Why does PostgreSQL sometimes choose Bitmap Index Scan instead of Index Scan?
#
It depends on selectivity and cost estimates. If PostgreSQL expects many matching rows, it may choose a bitmap path to batch heap page visits efficiently. In this lab, once the composite index aligns well with the predicate and we only need top-N rows, a plain Index Scan is often optimal.
Why is Time: ... ms different from Execution Time: ... ms?
#
Execution Time is reported by PostgreSQL as part of EXPLAIN ANALYZE.
The psql Time: line includes client-side overhead (printing, network, etc.). For reporting and analysis, prefer Execution Time + plan shape + BUFFERS.
Why can a second run be slower even with the same buffers? #
Because cache is not the only factor. CPU scheduling, background maintenance, and parallel worker timing can introduce variance. This is why single-run benchmarks are unreliable.